Core Web Vitals for Business Owners
LCP, INP, CLS in plain language: how each affects user experience, target thresholds, where to measure, and when to call a specialist.
Core Web Vitals Explained in Plain Language
We frequently hear from local founders who feel overwhelmed by the technical jargon surrounding website speed, which is exactly why having core web vitals explained clearly is so valuable. The reality is that site performance dictates whether your customers stay or leave. A 2025 MCMC Internet Users Survey found that 78% of Malaysian users will abandon a website if it fails to load within three seconds.
Our agency, Adam SEO, was founded in 2011 by SEO veteran Adam Yong on the premise that search engine rankings are meaningless without tangible business results. This means treating Google’s Core Web Vitals not just as a developer checklist, but as a critical conversion metric. These three metrics, often grouped simply as lcp inp cls, track exactly how fast your content loads, how quickly the page responds to taps, and how visually stable the layout remains.
Let’s explore the data behind these metrics and provide a clear roadmap so you understand exactly what your Technical SEO team needs to fix.
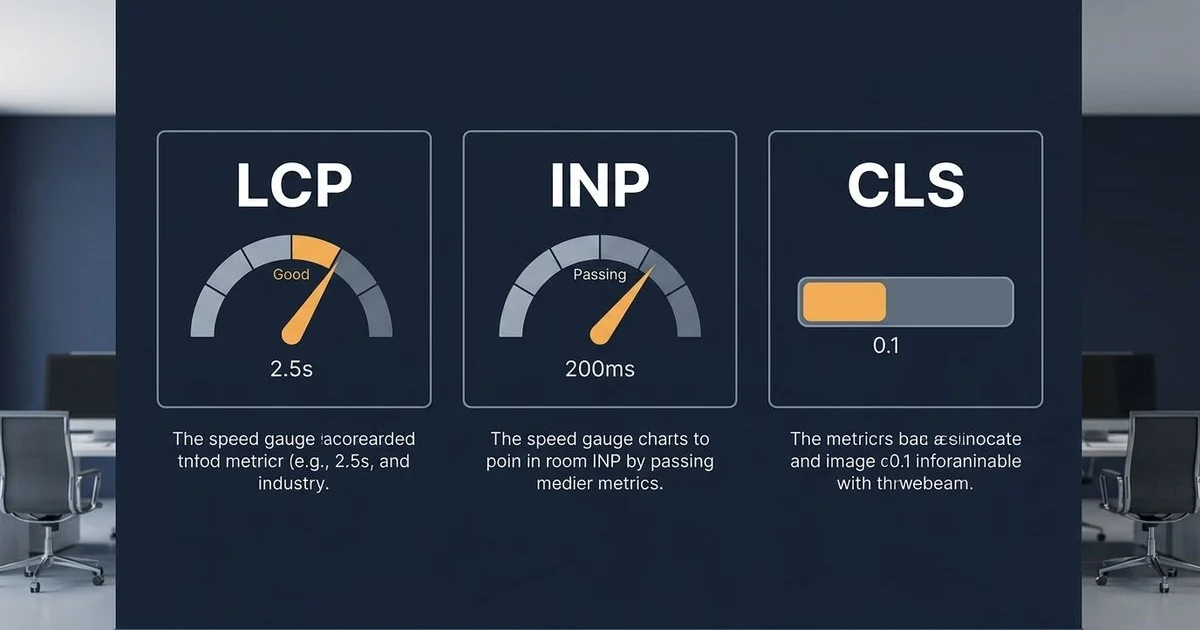
LCP: Largest Contentful Paint
Largest Contentful Paint measures how quickly the main visible element on your screen fully renders. This element is usually a large hero image, a promotional video banner, or a massive headline text block. We often see sites losing customers right at this exact moment. Mobile users are especially vulnerable, as the 2026 global average mobile load time sits at a sluggish 8.6 seconds. You need to beat that average significantly to keep visitors engaged.
Here are the official Google targets for this metric:
- Good: under 2.5 seconds
- Needs improvement: 2.5 to 4.0 seconds
- Poor: over 4.0 seconds
Our recent audits of Malaysian SMEs show that LCP failures frequently stem from massive, unoptimized image files on the homepage. Fixing this issue requires a targeted approach rather than a complete site rebuild. Start by compressing your images and serving them in next-generation formats like WebP or AVIF.
We strongly recommend giving your browser a clear priority list.
Set explicit width and height attributes in your code so the browser knows exactly how much space to reserve.
You should also load your most important hero image with a fetchpriority="high" attribute.
Finally, deploying a reliable Content Delivery Network like Cloudflare ensures these heavy assets are served quickly to users in Kuala Lumpur or Penang, helping you join the 67% of websites globally that now achieve a passing LCP score.
INP: Interaction to Next Paint
Interaction to Next Paint tracks how quickly your website responds when a customer actually taps a button or clicks a link. Google officially replaced First Input Delay with this much stricter metric in March 2024. We consider this the ultimate measure of how smooth your online store feels to a buyer.
If a customer taps a checkout button and the page freezes, they are highly likely to abandon the purchase entirely. The required performance targets leave very little room for error:
- Good: under 200 milliseconds
- Needs improvement: 200 to 500 milliseconds
- Poor: over 500 milliseconds
Our technical teams constantly trace INP failures back to heavy JavaScript tasks completely blocking the main browser thread. Common culprits in the local market include synchronously loaded WhatsApp chat widgets, massive Shopee tracking pixels, and complex review plugins like Yotpo. These scripts force the customer’s phone to process background data instead of responding to their tap.
We advise delaying non-critical scripts until after the main content has finished loading. Advanced development teams are now adopting an Island Architecture using modern frameworks like Next.js. This method only loads the interactive elements rather than processing the entire page codebase at once.
CLS: Cumulative Layout Shift
Cumulative Layout Shift calculates how much your page content unexpectedly jumps around while loading. A frustrating classic example occurs when a customer tries to click a confirmation button, but a late-loading promotional banner pushes the button downward, causing a misclick. We see this happen constantly on e-commerce platforms heavily reliant on third-party integrations.
To avoid penalizing the user experience, you must aim for these specific thresholds:
- Good: under 0.1
- Needs improvement: 0.1 to 0.25
- Poor: over 0.25
Our audits reveal that severe layout shifts typically stem from a few predictable coding errors. These common technical missteps include:
- Images missing explicit width and height dimensions in the HTML.
- Late-loading “Buy Now, Pay Later” badges, such as GrabPay or Atome widgets, pushing text down.
- Custom web fonts rendering late, causing the text to visibly resize mid-paint.
- Dynamic ads or embedded videos injecting themselves into the page without reserved space.
We highly recommend using CSS minimum height properties to carve out a dedicated space for any dynamic content before it even loads. These fixes are generally straightforward to implement. A competent developer can usually resolve the majority of these layout stability issues across a standard business website in just two to four hours.
How Each Affects User Experience and Conversion
Search engine algorithms view these technical scores as a direct reflection of website quality. We know that a sluggish interface actively repels potential buyers. Recent 2026 e-commerce data from Portant indicates that every single second of delay can slash conversion rates by over 4%. Beyond that, a 2025 Search Engine Journal study confirmed that domains passing all three performance thresholds are 24% more likely to secure a top-three ranking, proving that core web vitals seo alignment is essential.
Here is a clear breakdown of how failing these metrics hurts your revenue:
| Metric Failure Level | What the Customer Experiences | Direct Conversion Impact |
|---|---|---|
| LCP over 4.0s | The screen remains blank for too long, causing high abandonment. | Severe: Bounce rates spike dramatically before the user sees any products. |
| INP over 500ms | The page freezes when tapping “Checkout” or selecting a filter. | Severe: Extreme friction occurs right at the most critical buying moment. |
| CLS over 0.25 | The screen jerks around, leading to accidental taps on the wrong link. | Moderate to High: Misclicks create deep frustration and erode brand trust. |
Our experience proves that the financial penalty of a slow site compounds rapidly over time. A store failing these benchmarks does not just suffer from reduced organic search visibility. It actively wastes the expensive paid traffic it does manage to attract by delivering a frustrating, friction-filled shopping journey.
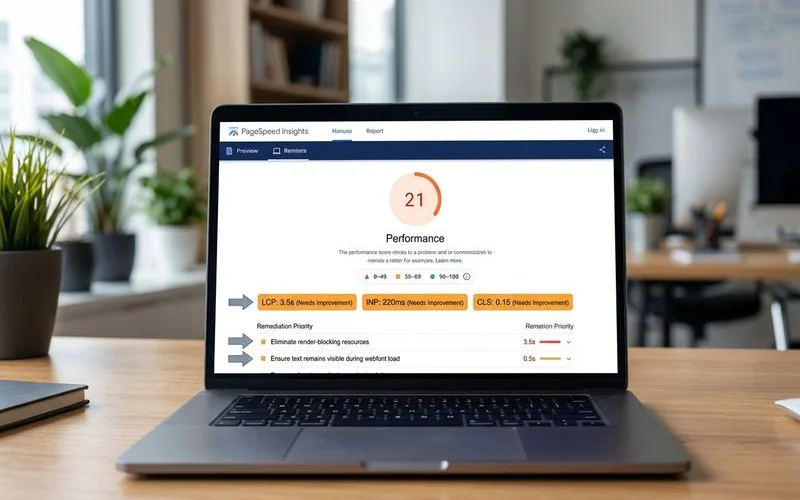
Where to Measure
The Core Web Vitals measurement stack
Lab data: PageSpeed Insights (an instant diagnostic test). Field data: Google Search Console under Experience > Core Web Vitals (representing real users over a rolling 28-day period). Granular field data: The Chrome User Experience Report (CrUX) dashboard. For the vast majority of local businesses, combining Search Console with PageSpeed Insights easily covers 90% of diagnostic needs.
We always advise looking at both controlled lab tests and real-world field metrics. These two data sources serve different purposes and will occasionally report different numbers. Field data represents actual customer experiences, specifically calculated at the 75th percentile of all mobile and desktop visits, and this is the exact metric search engines use for ranking.
Our engineers rely on lab data to test specific code changes in real time. Your development team should use lab tools to quickly iterate and fix issues before pushing them live. For deeper investigations into complex interaction delays, advanced profiling tools like WebPageTest or Catchpoint Real User Monitoring provide the granular timeline data needed to isolate exactly which script is causing the freeze.
We recommend optimizing heavily against your lab metrics first, and then waiting a few weeks to verify the positive impact in your live field data. Patience is required here since field scores only update after a rolling 28-day data collection cycle.
When to Call a Specialist
Business owners often wonder how much of this technical cleanup can be handled in-house. Many basic speed improvements are highly achievable if your current developer has a few hours to spare. We typically categorize the following quick wins as standard, DIY-able maintenance:
- Compressing massive homepage hero images.
- Configuring lazy loading for below-the-fold product galleries.
- Preloading custom web fonts to prevent text flickering.
- Activating a Content Delivery Network like Cloudflare.
In fact, over 40 million websites currently utilize CDNs to successfully speed up their asset delivery without needing a major architectural overhaul. However, certain deeply ingrained performance issues fall strictly into specialist territory. Our senior developers are frequently called in when a business encounters severe interaction delays rooted in outdated framework architecture.
Complex problems like migrating a bloated Magento store to a modern partial hydration setup require advanced engineering skills. The same applies to unpicking years of technical debt accumulated inside heavily customized Shopify themes. These scenarios demand major code refactoring rather than simple plugin installations.
We structure the initial discovery audit during our Technical SEO services to explicitly categorize every single issue. This triage process clearly separates the accessible DIY tasks from the complex bottlenecks, ensuring you know exactly what to hand to your existing team and what truly requires senior technical intervention.
Bridge to the Engagement
If your latest speed reports are showing consistent failures, it is time to stop guessing and start diagnosing the root cause. We encourage you to request a technical audit so our experts can model a precise remediation plan based on actual revenue impact. You can also review these common technical SEO issues to understand the broader context of your website’s performance and take the necessary steps for a faster, more profitable online store now that you have these core web vitals explained.
Related Guides
Common Technical SEO Issues That Kill Rankings (And How to Fix Them)
Top technical SEO issues: crawl errors, robots.txt mistakes, broken canonicals, mobile usability, slow Core Web Vitals, indexing problems.
How to Recover From a Google Penalty in 30 Days
Manual + algorithmic penalty diagnosis, GSC manual-action review, disavow file process, content remediation, reconsideration request — realistic timeline.
Frequently Asked Questions
Do Core Web Vitals actually affect rankings?
Yes. They are a confirmed Google ranking signal since 2021, weighted modestly but real. The ranking impact compounds with related user-experience signals — bounce rate, time on page, return visits — so the practical effect is larger than the direct ranking weight suggests.
Can I improve Core Web Vitals without a redesign?
Often yes. Image compression, lazy loading, font preload, deferred JavaScript usually move the needle without a rebuild. Major rebuilds are required only when the codebase has structural blockers — heavy JS frameworks rendering above-fold content, unminified theme files, render-blocking third-party scripts.
What is the biggest Core Web Vitals killer?
Hero images that aren't optimized. They are the single largest LCP factor on most sites. WebP/AVIF format, explicit dimensions, fetchpriority='high', and lazy loading below-fold images are the four interventions that fix LCP for most Malaysian sites.